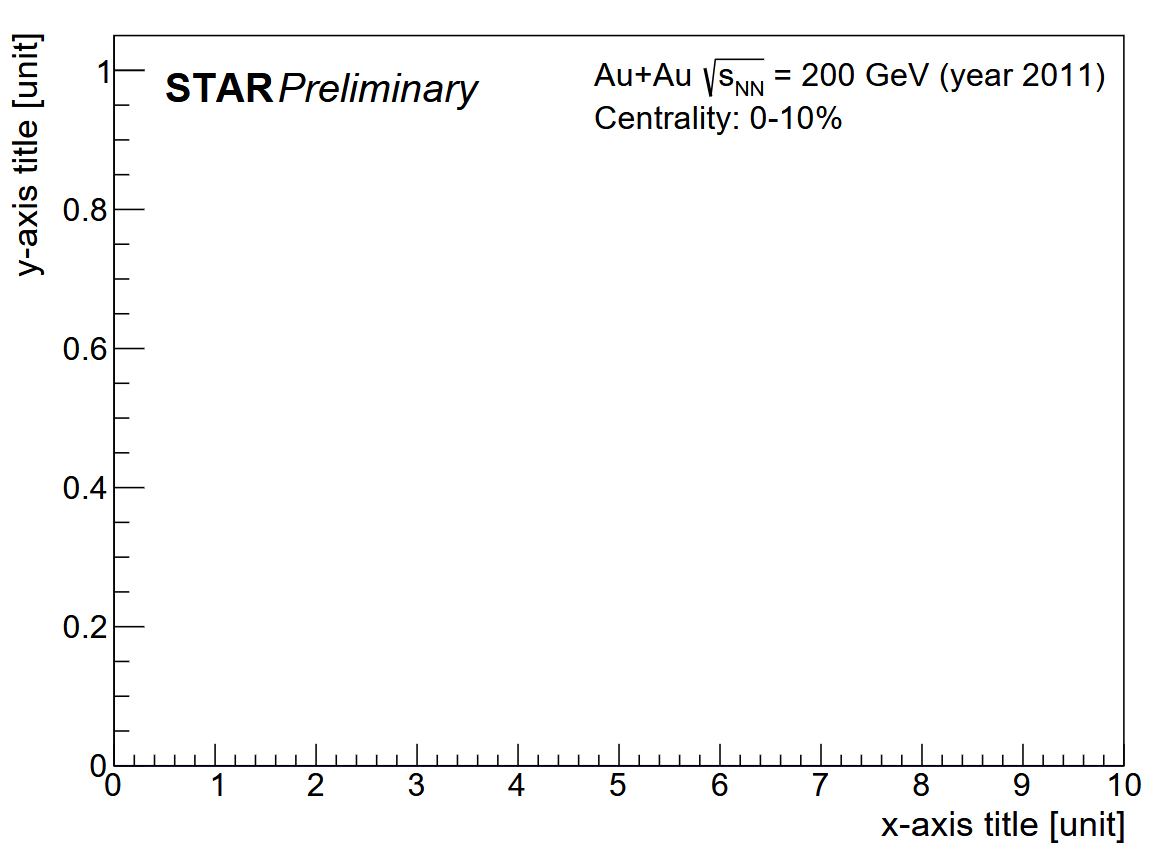
Preliminary figures guidances
- All the preliminary figures MUST contain a “STAR Preliminary” label.
- On the preliminary figures, x-axis and y-axis titles, labels, and tick markers should be clearly visible.
- Information about the dataset used for the preliminary figure, such as year, collision system, collision energy, and centrality (if applicable), needs to be displayed.
- Other key information, such as the kinematic cuts, legend, etc., should be added as well.
- The legend should not overlap with data points. Keep the legend organized and in one place if possible.
- Font size should be reasonably large such that the audience can clearly see them.
- Avoid invisible colors like Cyan, Green, and Yellow for markers and uncertainty boxes.
Archive with preliminaries: https://drupal.star.bnl.gov/STAR/pwg/common/star-preliminary-results-archive
📌 Template
- This template is meant as an example. Please feel free to modify it or use your own style. Please make sure that all the key information is displayed properly on the figure.

{
  TCanvas *can = new TCanvas("can", "", 800, 600);

  gStyle->SetOptStat(0);
  gStyle->SetTitleFont(42, "XYZ");
  gStyle->SetLabelFont(42, "XYZ");
  gStyle->SetTitleSize(0.045, "XYZ");
  gStyle->SetLabelSize(0.040, "XYZ");

  can->SetFillColor(0);
  can->SetBorderMode(0);
  can->SetBorderSize(2);
  can->SetRightMargin(0.045);
  can->SetTopMargin(0.045);
  can->SetFrameBorderMode(0);

  TH1F *h = new TH1F("hplot", "", 100, 0, 10);
  h->SetLineColor(TColor::GetColor("#000099"));
  h->GetXaxis()->SetTitle("x-axis title [unit]");
  h->GetYaxis()->SetTitle("y-axis title [unit]");
  h->GetYaxis()->SetTitleOffset(1.0);
  h->GetXaxis()->SetNdivisions(515);
  h->Draw();

  static TLatex tex;
  tex.SetNDC();

  tex.SetTextAlign(11);
  tex.SetTextFont(42);
  tex.SetTextSize(0.04);
  tex.DrawLatex(0.50, 0.90, "Au+Au #sqrt{s_{NN}} = 200 GeV (year 2014)");
  tex.DrawLatex(0.50, 0.85, "Centrality: 0-10%");

  tex.SetTextFont(62);
  tex.SetTextSize(0.05);
  tex.DrawLatex(0.15, 0.90, "STAR");

  tex.SetTextFont(52);
  tex.SetTextSize(0.05);
  tex.DrawLatex(0.25, 0.90, "Preliminary");

  can->SaveAs("preliminary.pdf");
}

}